Tuttitalia | nonsoloCAP | Calcolo Codice Fiscale
Home » Italia » Piemonte » Provincia di Alessandria » Cerreto Grue » Statistiche » Indici demografici e Struttura

- Popolazione 2001-2022
- Pop. età, sesso, stato civile
- Popolaz. per età scolastica
- Cittadini Stranieri
- Indici Demografici e Struttura
- Sindaco, Giunta, Consiglio
- Storico Elezioni Comunali
- Fatturazione elettronica
- Scuole Cerreto Grue
- Banche Cerreto Grue
- Rischio Sismico
- Classificazione Climatica
- Comuni Limitrofi
- Mappa e Stradario
Annunci Cerreto Grue
Speciali
Pagine Utili
- Sindaci in provincia di AL
- Centralini Comuni prov. AL
- Prefissi Telefonici prov. AL
- CAP comuni in prov. di AL
- Presidenti delle Province
- Presidenti delle Regioni
- Fusione Comuni PIE
Classifiche
- Comuni in provincia di AL
- Province piemontesi
- Regioni italiane
- Città Metropolitane
- Comuni capoluogo
- Comuni > 60.000 abitanti
- Comuni < 150 abitanti
- Comuni /fasce demografiche
- Comuni < 5.000 abitanti
Turismo in Rete
Struttura della popolazione e indicatori demografici di Cerreto Grue negli ultimi anni. Elaborazioni su dati ISTAT
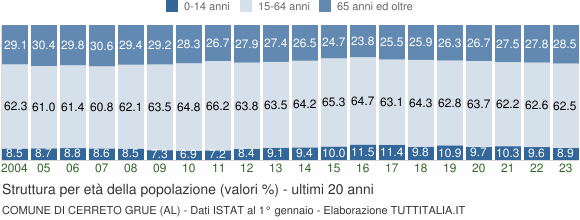
Struttura della popolazione dal 2002 al 2023
L'analisi della struttura per età di una popolazione considera tre fasce di età: giovani 0-14 anni, adulti 15-64 anni e anziani 65 anni ed oltre. In base alle diverse proporzioni fra tali fasce di età, la struttura di una popolazione viene definita di tipo progressiva, stazionaria o regressiva a seconda che la popolazione giovane sia maggiore, equivalente o minore di quella anziana.
Lo studio di tali rapporti è importante per valutare alcuni impatti sul sistema sociale, ad esempio sul sistema lavorativo o su quello sanitario.
| Anno 1° gennaio | 0-14 anni | 15-64 anni | 65+ anni | Totale residenti | Età media |
|---|---|---|---|---|---|
| 2002 | 30 | 194 | 114 | 338 | 50,7 |
| 2003 | 29 | 188 | 119 | 336 | 51,6 |
| 2004 | 29 | 212 | 99 | 340 | 49,2 |
| 2005 | 30 | 211 | 105 | 346 | 50,6 |
| 2006 | 30 | 208 | 101 | 339 | 49,9 |
| 2007 | 29 | 205 | 103 | 337 | 50,5 |
| 2008 | 28 | 205 | 97 | 330 | 49,7 |
| 2009 | 23 | 200 | 92 | 315 | 50,2 |
| 2010 | 22 | 206 | 90 | 318 | 50,5 |
| 2011 | 23 | 213 | 86 | 322 | 50,0 |
| 2012 | 27 | 206 | 90 | 323 | 50,3 |
| 2013 | 29 | 202 | 87 | 318 | 50,0 |
| 2014 | 30 | 206 | 85 | 321 | 49,8 |
| 2015 | 32 | 209 | 79 | 320 | 48,9 |
| 2016 | 37 | 209 | 77 | 323 | 48,2 |
| 2017 | 36 | 200 | 81 | 317 | 48,3 |
| 2018 | 30 | 196 | 79 | 305 | 49,7 |
| 2019* | 33 | 191 | 80 | 304 | 49,4 |
| 2020* | 29 | 191 | 80 | 300 | 49,9 |
| 2021* | 31 | 188 | 83 | 302 | 49,8 |
| 2022* | 29 | 189 | 84 | 302 | 49,9 |
| 2023* | 26 | 182 | 83 | 291 | 50,2 |
(*) popolazione post-censimento
Indicatori demografici
Principali indici demografici calcolati sulla popolazione residente a Cerreto Grue.
| Anno | Indice di vecchiaia | Indice di dipendenza strutturale | Indice di ricambio della popolazione attiva | Indice di struttura della popolazione attiva | Indice di carico di figli per donna feconda | Indice di natalità (x 1.000 ab.) | Indice di mortalità (x 1.000 ab.) |
|---|---|---|---|---|---|---|---|
| 1° gennaio | 1° gennaio | 1° gennaio | 1° gennaio | 1° gennaio | 1 gen-31 dic | 1 gen-31 dic | |
| 2002 | 380,0 | 74,2 | 106,3 | 113,2 | 0,0 | 8,9 | 14,8 |
| 2003 | 410,3 | 78,7 | 115,4 | 123,8 | 0,0 | 3,0 | 20,7 |
| 2004 | 341,4 | 60,4 | 175,0 | 128,0 | 0,0 | 2,9 | 8,7 |
| 2005 | 350,0 | 64,0 | 288,9 | 139,8 | 0,0 | 14,6 | 35,0 |
| 2006 | 336,7 | 63,0 | 230,0 | 126,1 | 0,0 | 5,9 | 11,8 |
| 2007 | 355,2 | 64,4 | 191,7 | 133,0 | 0,0 | 12,0 | 24,0 |
| 2008 | 346,4 | 61,0 | 163,6 | 150,0 | 0,0 | 0,0 | 21,7 |
| 2009 | 400,0 | 57,5 | 146,2 | 150,0 | 0,0 | 6,3 | 15,8 |
| 2010 | 409,1 | 54,4 | 143,8 | 171,1 | 0,0 | 3,1 | 6,3 |
| 2011 | 373,9 | 51,2 | 153,3 | 159,8 | 0,0 | 6,2 | 27,9 |
| 2012 | 333,3 | 56,8 | 218,2 | 164,1 | 0,0 | 3,1 | - |
| 2013 | 300,0 | 57,4 | 300,0 | 159,0 | 0,0 | 6,3 | 18,8 |
| 2014 | 283,3 | 55,8 | 328,6 | 164,1 | 0,0 | 6,2 | 21,8 |
| 2015 | 246,9 | 53,1 | 600,0 | 161,3 | 0,0 | 15,6 | 15,6 |
| 2016 | 208,1 | 54,5 | 700,0 | 175,0 | 0,0 | 6,3 | 15,6 |
| 2017 | 225,0 | 58,5 | 325,0 | 177,8 | 0,0 | 0,0 | 9,6 |
| 2018 | 263,3 | 55,6 | 344,4 | 216,1 | 0,0 | 6,6 | 26,3 |
| 2019 | 242,4 | 59,2 | 350,0 | 208,1 | 0,0 | 3,3 | 16,6 |
| 2020 | 275,9 | 57,1 | 236,4 | 213,1 | 0,0 | 3,3 | 13,3 |
| 2021 | 267,7 | 60,6 | 169,2 | 208,2 | 0,0 | 6,6 | 19,9 |
| 2022 | 289,7 | 59,8 | 157,1 | 209,8 | 0,0 | 6,7 | 27,0 |
| 2023 | 319,2 | 59,9 | 146,7 | 225,0 | 0,0 | - | - |
Glossario
Indice di vecchiaia
Rappresenta il grado di invecchiamento di una popolazione. È il rapporto percentuale tra il numero degli ultrassessantacinquenni ed il numero dei giovani fino ai 14 anni. Ad esempio, nel 2023 l'indice di vecchiaia per il comune di Cerreto Grue dice che ci sono 319,2 anziani ogni 100 giovani.Indice di dipendenza strutturale
Rappresenta il carico sociale ed economico della popolazione non attiva (0-14 anni e 65 anni ed oltre) su quella attiva (15-64 anni). Ad esempio, teoricamente, a Cerreto Grue nel 2023 ci sono 59,9 individui a carico, ogni 100 che lavorano.Indice di ricambio della popolazione attiva
Rappresenta il rapporto percentuale tra la fascia di popolazione che sta per andare in pensione (60-64 anni) e quella che sta per entrare nel mondo del lavoro (15-19 anni). La popolazione attiva è tanto più giovane quanto più l'indicatore è minore di 100. Ad esempio, a Cerreto Grue nel 2023 l'indice di ricambio è 146,7 e significa che la popolazione in età lavorativa è molto anziana.Indice di struttura della popolazione attiva
Rappresenta il grado di invecchiamento della popolazione in età lavorativa. È il rapporto percentuale tra la parte di popolazione in età lavorativa più anziana (40-64 anni) e quella più giovane (15-39 anni).Carico di figli per donna feconda
È il rapporto percentuale tra il numero dei bambini fino a 4 anni ed il numero di donne in età feconda (15-49 anni). Stima il carico dei figli in età prescolare per le mamme lavoratrici.Indice di natalità
Rappresenta il numero medio di nascite in un anno ogni mille abitanti.Indice di mortalità
Rappresenta il numero medio di decessi in un anno ogni mille abitanti.Età media
È la media delle età di una popolazione, calcolata come il rapporto tra la somma delle età di tutti gli individui e il numero della popolazione residente. Da non confondere con l'aspettativa di vita di una popolazione.Struttura dei comuni vicini
Montegioco 2,0km | Costa Vescovato 2,9km | Sarezzano 3,1km | Villaromagnano 3,5km | Paderna 3,9km | Berzano di Tortona 4,2km | Spineto Scrivia 4,5km | Carezzano 4,6km | Carbonara Scrivia 4,8km | Castellania Coppi 4,9km | Montemarzino 5,0km | Avolasca 5,2km | Monleale 5,8km | Volpeglino 6,1km | Casasco 6,2km | Sant'Agata Fossili 6,5km | Villalvernia 6,5km | Volpedo 6,7km | Viguzzolo 6,9km | Castellar Guidobono 7,2km
In grassetto sono riportati i comuni confinanti. Le distanze sono calcolate in linea d'aria dal centro urbano. Vedi l'elenco completo dei comuni limitrofi a Cerreto Grue ordinati per distanza.